}

Overview

This case study illustrates how MediVerse's voice-driven VR interface streamlines exploration of pediatric leukemia datasets, eliminating the need for SQL or complex menu navigation. The dataset comprises two core tables: Patient Clinical Data and Patient Treatments.

Workflow

  1. Schema Definition & Data Import. Define table schema and import CSVs.
  2. Voice-Driven Plotting. “Show a scatter plot of initial WBC versus initial blast counts for all patients by risk” generates a 3D plot colored by risk stratification.
  3. Scatter plot of initial WBC vs blast counts by risk stratification
    Fig. 1. Initial WBC vs Blast Counts by Risk Stratification
  4. Narrow to High-Risk. “Show a scatter plot of initial WBC versus initial blast counts for high-risk patients” limits the view to high-risk group.
  5. Color by Gender. “Show a scatter plot of initial WBC versus initial blast counts for high-risk patients color by gender” updates coloring for immediate visual comparison.
  6. Gender-colored scatter plot of high-risk patients
    Fig. 2. Gender-colored scatter plot of high-risk patients
  7. Interactive Table. “List all high-risk patients whose blast counts exceed 50 × 109” renders an in-VR table with patient ID, blast count, and clinical details.
  8. Table of high-risk patients with blast counts exceeding threshold
    Fig. 3. High-risk patients with Blast Counts Exceeding 50 × 109
  9. Clinical Explanation. “Why spike in WBC counts for patient ALL101 post treatment initiation” triggers a synthesized clinical explanation highlighting possible biological mechanisms.
  10. MediVerse clinical explanation for patient ALL101
    Fig. 4. MediVerse clinical explanation for patient ALL101

Results & Impact

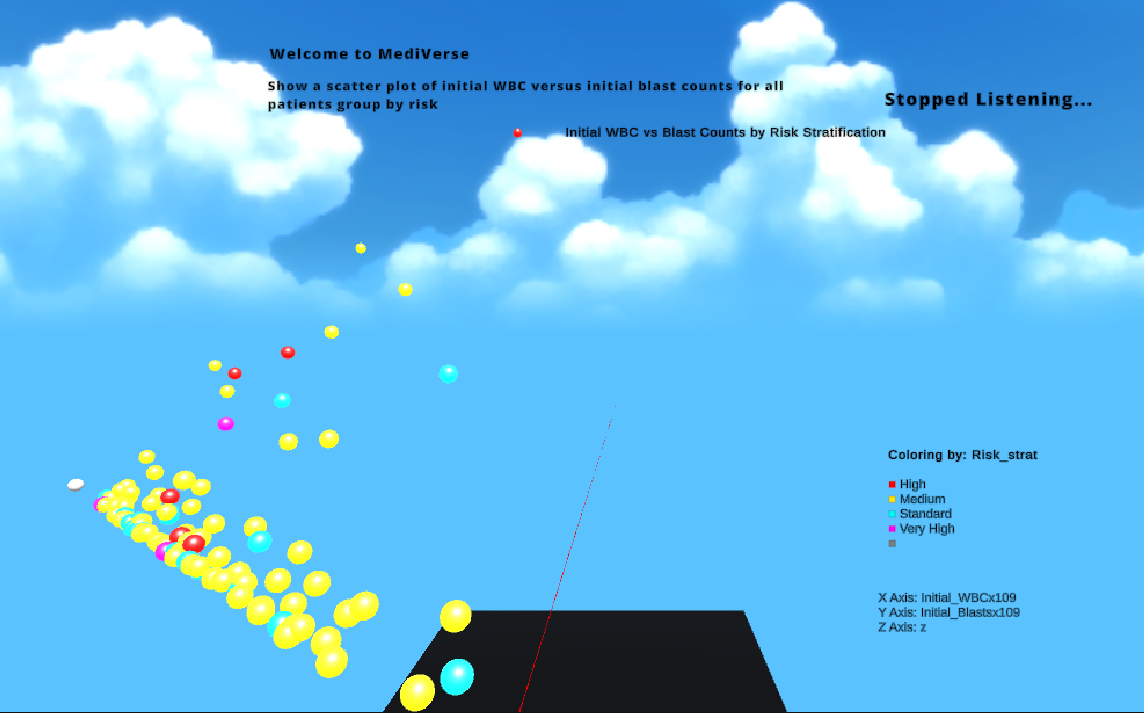
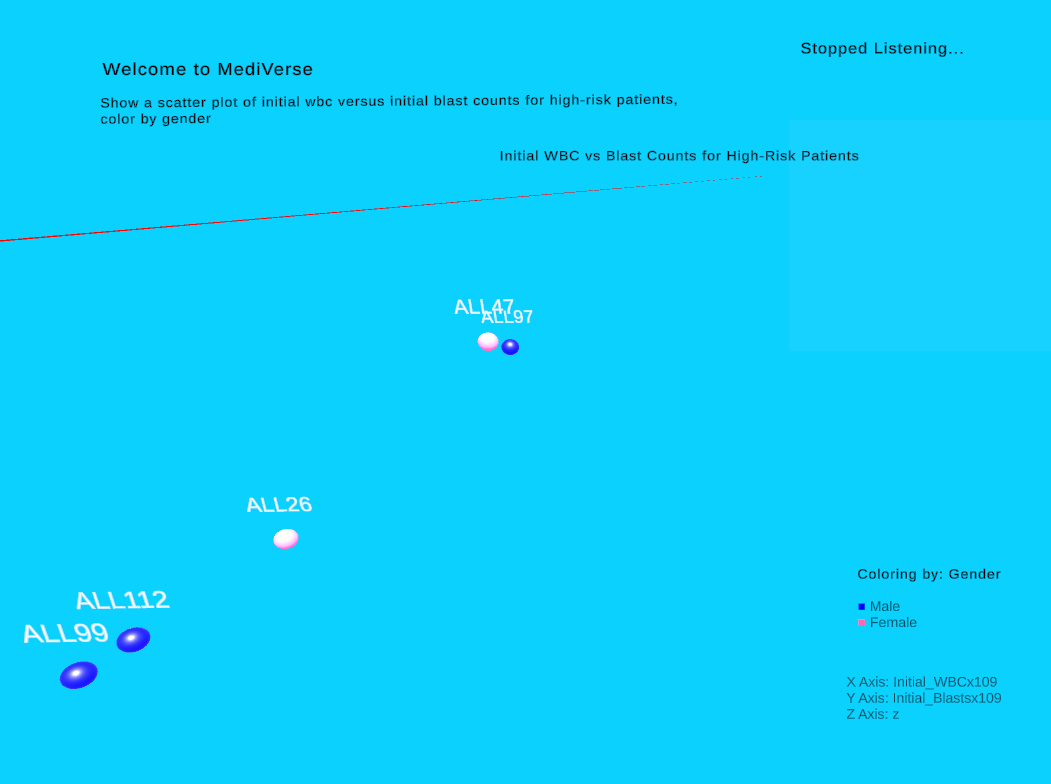
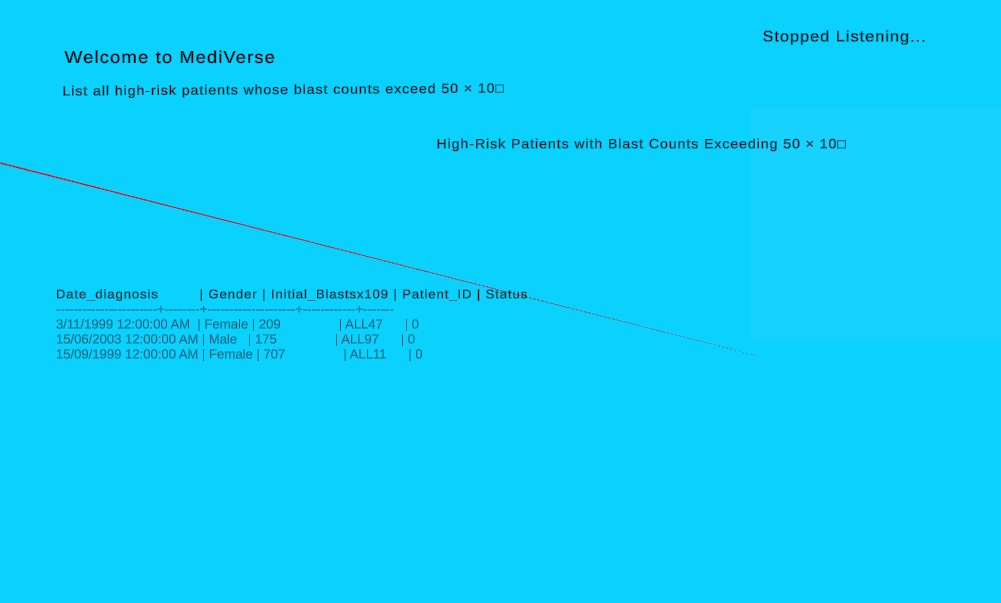
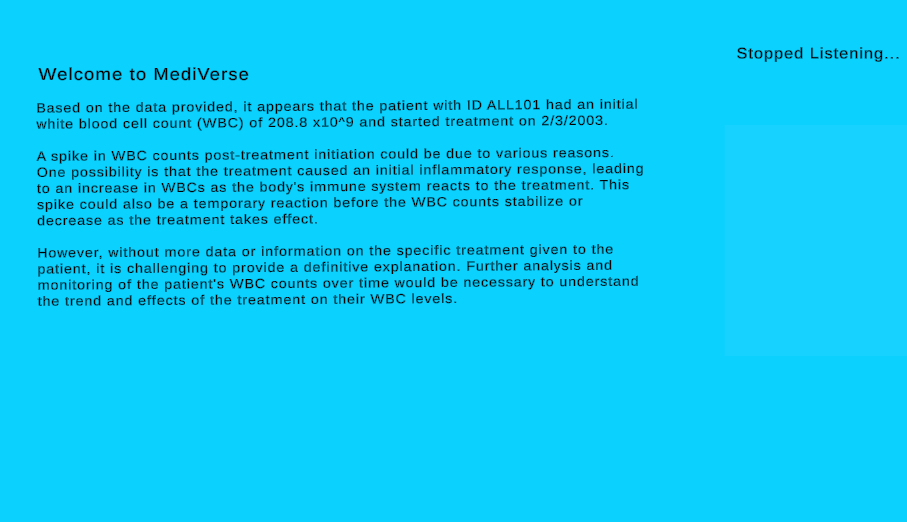
MediVerse enables seamless voice-driven transitions between scatter plots, interactive tables, and clinical narratives within a VR environment. Clinicians can explore gender differences in blast counts or compare treatment efficacy without leaving the immersive workspace.