Home›Case Study 2
Pediatric rhabdomyosarcoma: multimodal genomic and clinical analysis
How MediVerse integrates gene expression and clinical data in a single voice-driven workspace.
Overview
This case study highlights how MediVerse's voice-driven VR interface enables sophisticated multimodal analysis of pediatric rhabdomyosarcoma (RMS) by integrating genomic and clinical data seamlessly, without SQL or manual navigation. Imported datasets include the gene expression intensity matrix and SVD results.
Workflow
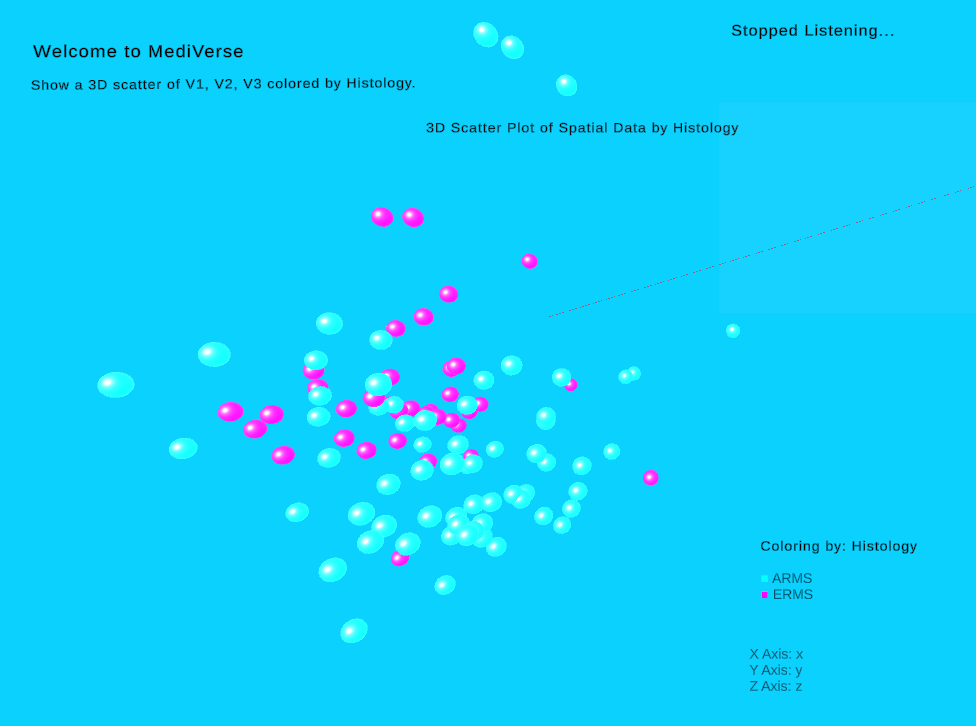
- Initial scatter by histology. Voice command: "Show a 3D scatter of V1, V2, V3 coloured by histology."
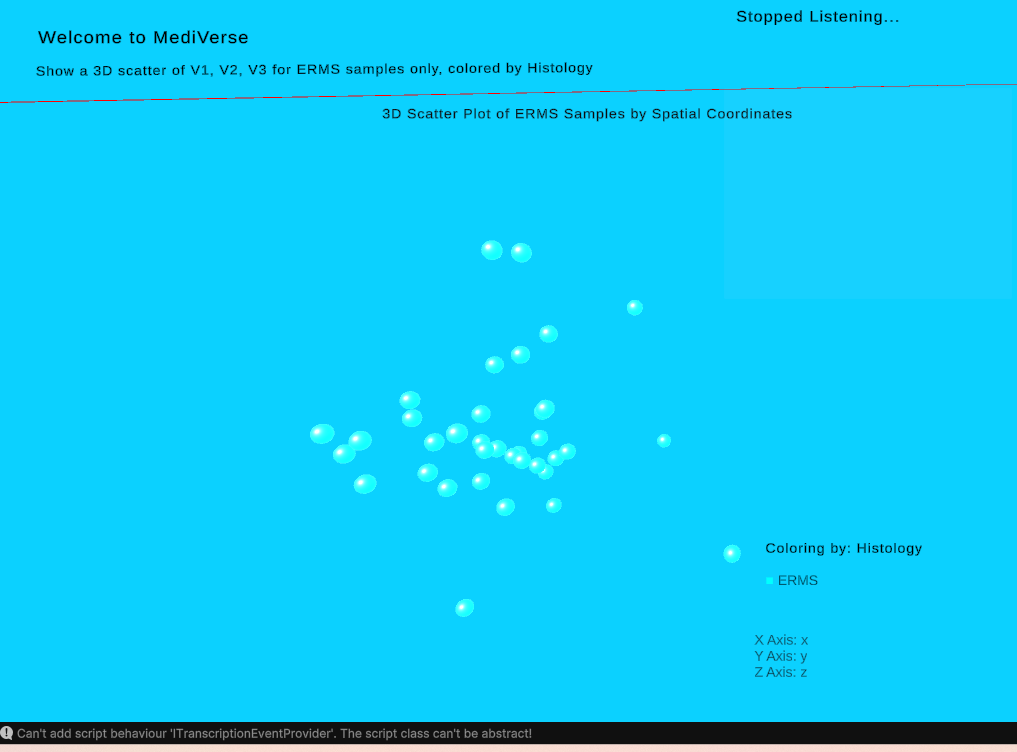
- ERMS samples only. "Show a 3D scatter of V1, V2, V3 for ERMS samples only, coloured by histology."
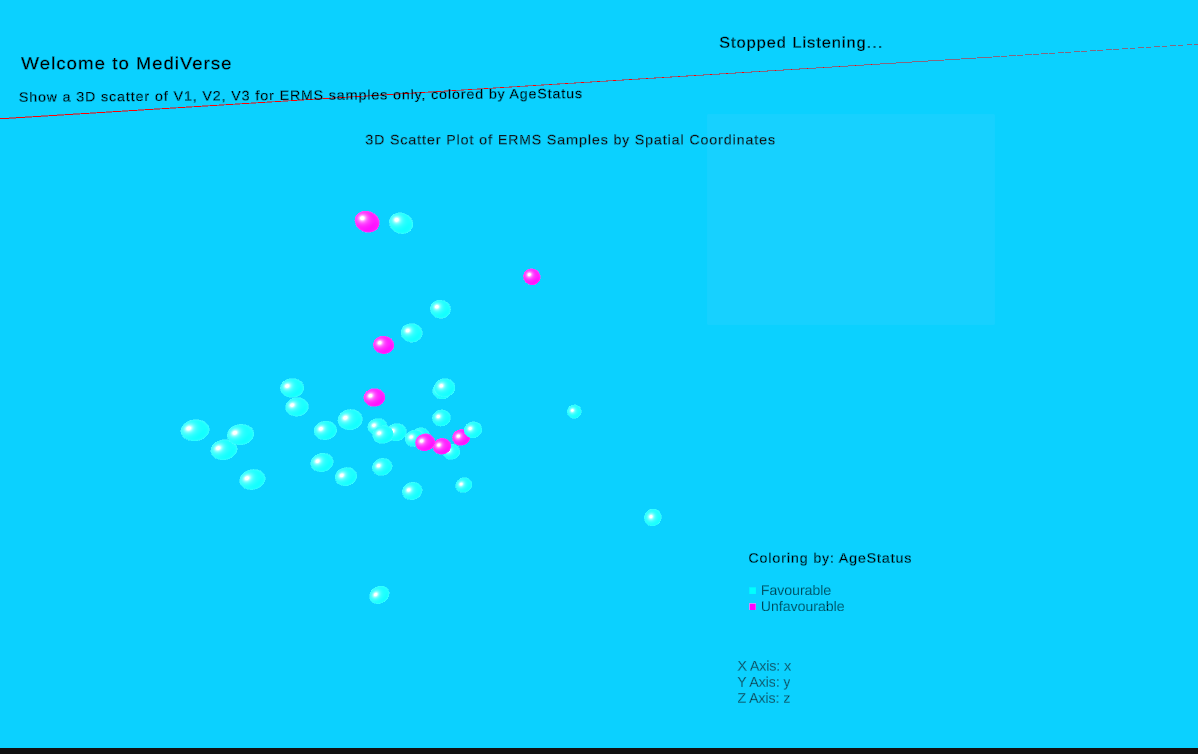
- Colour by age status. "Show a 3D scatter of V1, V2, V3 for ERMS samples only, coloured by AgeStatus."
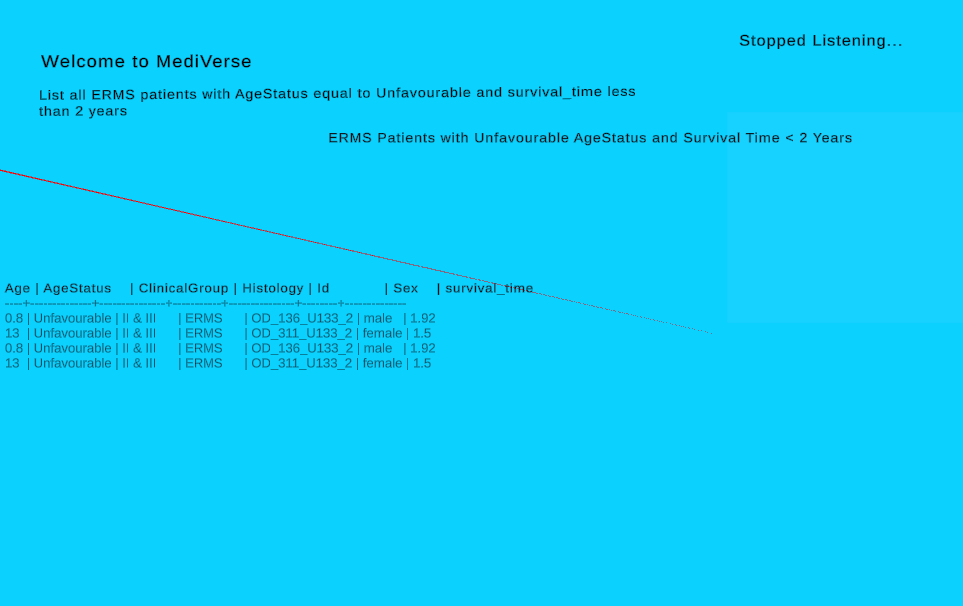
- High-risk ERMS patients. "List all ERMS patients with AgeStatus equal to Unfavourable and survival_time less than 2 years."
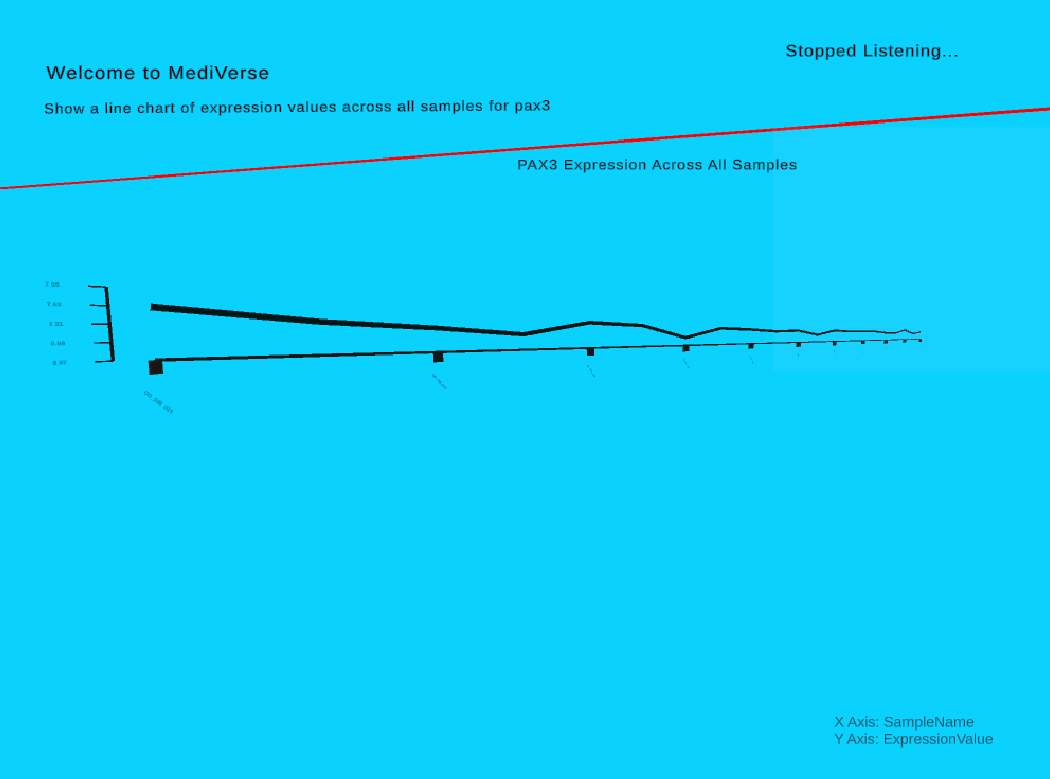
- PAX3 expression line chart. "Show a line chart of expression values across all samples for pax3."
Results & impact
MediVerse enables intuitive, natural-language-driven exploration of integrated genomic and clinical datasets in VR. Researchers can uncover relationships between histological subtypes, prognostic age groups, and gene expression patterns, all within an immersive environment.